
Chapter 01 - Changes and Definitions
Welcome to this Sociology of the Family Free Online textbook. I am the author and have worked with my own university students over these recent years to provide open courseware free textbooks for anyone, anywhere who would like to read them. As of the writing of this edition, over 500,000 students have used our free books and many of them live in many diverse countries around the world.
I have a Ph.D. in Sociology of Family Studies from Brigham Young University (Class of 1991) and have taught Sociology of the Family for over 30 years. I have taught thousands of students how to understand the family using sociology as a framework for gaining insight and expertise. Most of my students did not continue on in the field of family studies, but a few are now professors in their own right and others are therapists practicing in their communities. My first full-time gig as a professor of sociology was in a community college where administrators demanded that we provide a service to our students that was worth the money they paid us for teaching. I have honored that professional commitment ever since. So we hope you will enjoy the chapter.
My purpose in teaching about the family is to provide you with information that is scientifically sound and practically useful. It is not enough for me to simply spread facts. I want to tell students what works, what doesn't work, and how to tell the difference in finding real solutions to their own life troubles. Call it bias or just common sense, if you read this book you'll find more answers than questions.
In all societies, the family is the premier institution for all of the following: socialization of children, adult intimate relationships, lifelong economic support and cooperation, and continuity of relationships along the life course. Sociologists are leaders among scientists who study the family. They function in a core assessment role for describing, explaining, and predicting family-based social patterns for the United States and other countries of the world. Sociologists allow us to understand the larger social and personal-level trends in families.
Family Structures
The family structures that were very common a century ago are not nearly as common today. In the U.S. around the year 1900 most families had three generations living in one home (i.e., children, parents, and grandparents). In 2012, only 4.6 percent of all US households had multi-generational family members living in them (retrieved 6 June 2014 from SOURCE America’s Families and Living Arrangements: 2012, P20-570). Most modern families take one of two forms: nuclear or blended. The Nuclear Family is a family group consisting of a mother and a father and their children. This is the family type that is mostly preferred. One variation of this type is the single-parent family, which can be created by unwed motherhood, divorce, or death of a spouse. The second most common type of family is the Blended Family, which is a family group created by remarriage that includes step-parents or step-siblings or both. All of the family relationships beyond the basic two-generation nuclear or blended family we call Extended Family, which includes relatives beyond nuclear and blended family levels (i.e., cousins, aunts and uncles, grandparents and great grandparents) .
The U.S. Census Bureau conducts annual surveys of the U.S. population and publishes them as the Current Population Surveys. Table 1 represents the numbers and percentages of 2019 and 2011 U.S. Family Types. You will notice that marrieds comprised the largest proportion of family types in 2019 and in 2011. Marriage is still the marital status preferred the most and it might include first marriages, second or later marriages (remarriages, heterosexual or same-sex marriages inter-racial or inter-ethnic marriages, traditional or conservative marriages. Both the number and the percentage of marriages increased from 2011 to 2019. The widowed were fairly constant with few changes. The divorced and separated increased in numbers but not in percentages. The never married singles also increased in numbers and percentages from 2011 to 2019.
Table 1. US Family Types, 2019 and (2011)
| Types | 2019 & (2011) Numbers in Millions | 2019 & (2011) Percentages |
|---|---|---|
| Married | 137 & (123.9) | 53% & (52%) |
| Widowed | 14.2 & (14.2) | 6% & (6%) |
| Divorced & Seperated | 40.3 & (30.0) | 11% & (12.6%) |
| Never Married-Single | 85.2 & (75.8) | 32 % & (30%) |
There has been a marked increase of non-married cohabiting couples over the last few decades.which PewResearch reported is continuing on the rise as of 2019. Pew Research reported in as of 2017, 50 percent of adults had ever married and 59 percent had ever cohabited. This is changed from their 2002 findings that about 60 percent had ever married and only 54 percent had ever cohabited. PewResearch also reported that from 1995 to 2019 the share of adults who are living with an unmarried partner has risen from 3% to 7%.” The report also noted that 78 percent of young adults gave an indication of approval for a couple cohabiting (compared to only 36% of 65 and older adults giving approval to cohabitation). (Marriage and Cohabitation in the U.S., 6 Nov. 2019 retrieved 1 July 2020 from SOURCE ) Interestingly, the same report evaluated results from PewResearch surveys and found out that the majority of U.S. adults who cohabit and those who are married expressed a great deal of trust in their partner or spouse. But the married adults expressed more trust than the cohabiting ones in their spouse/partner’s: being faithful to them (84% Mar. & only 71% Cohab); acting in their best interest (74% Mar. & only 58% Cohab.); always telling the truth (68% Mar. & only 52% Cohab.); and handling money responsibly (56% Mar. & only 40% Cohab.).
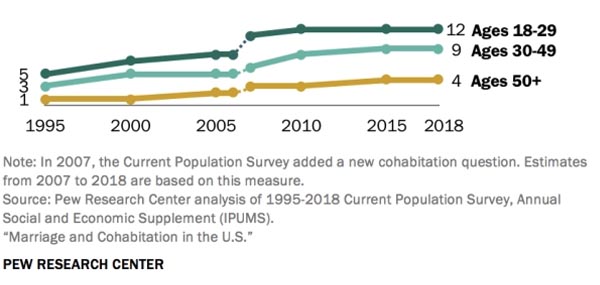
When asked why they cohabited, they replied: “love” (90% Mar. & only 73% Cohab.); “companionship” (86% Mar. & only 61% Cohab.); “wanted to make a formal commitment” (63% Mar. & only 63% Cohab.); “it made sense financially” (38% Mar. & only 13% Cohab.); “they wanted to have children someday” (31% Mar. & only 14% Cohab.); “it was convenient” (37% Mar. & only 10% Cohab.); and “wanted to test the relationship” (23% Mar. & only 23% Cohab.). Figure 1 shows the PewResearch reports diagram of U.S. cohabitation rates between 1995 and 2018. These have flattened in recent years (there is not a real increase or decrease for most age groups).
Figure 1. PewResearch Diagram of U.S. Cohabitation Rates* 1995-2018
In 2012 the U.S. Census Bureau reported that there were also 7,845,000 million heterosexual cohabiters and about 687,000 same-sex cohabiters (retrieved 6 June 2014 from America’s Families and Living Arrangements: 2012, P20-570, Tables 3 & 7). But, in 2017, Gallup reported that Same-sex cohabitation had declined from 12.8 percent before the Supreme Court Ruled in favor of Same-sex marriage (Obergefell v. Hodges, 26 June 2015) down to only 6.6 percent by 2017. Why the change? The same Gallup report found an that there were about 10.2 percent of lesbian, gay, bisexual, or transgendered (LGBT) adults who were legally married to a same sex spouse. The report stated that: “Two years after the Supreme Court ruled in Obergefell v. Hodges that states could not prohibit same-sex marriages, 10.2% of lesbian, gay, bisexual or transgender (LGBT) adults in the U.S. are married to a same-sex spouse. That is up from 7.9% in the months prior to the Supreme Court decision in 2015, but only marginally higher than the 9.6% measured in the first year after the ruling.” (see Jones, J. M., (22 June 2017) “In U.S., 10.2% of LGBT Adults Now Married to Same-Sex Spouse
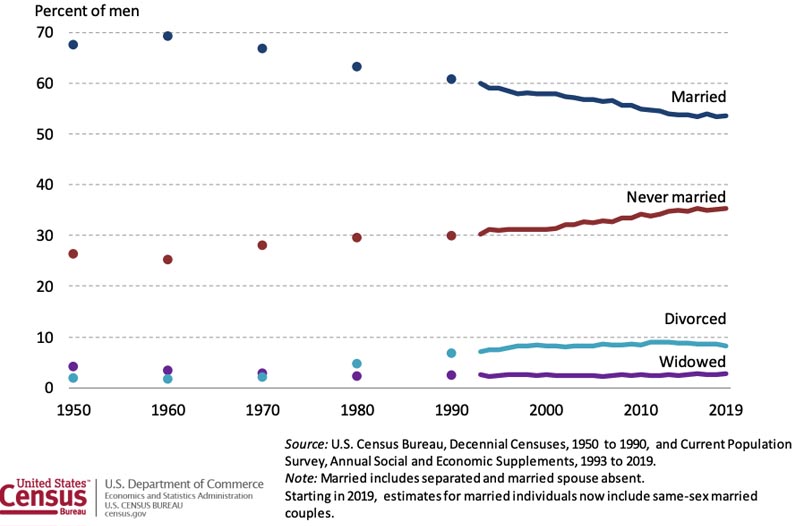
Marital status composition is changing for the entire society as well. What do U.S. Census data show the changes in proportions of marital status for men and for women to be between 1950 and 2019? Look at Figure 2 below to see the U.S. trend of percentages of U.S. Men’s marital status types between the years 1950-2019. It shows that the most common marital status is still married (down from a high of about 70% in 1960 to about 53% in 2019). The rising trend is clearly among the never married singles which rose from about 26 percent in 1950 to about 36% in 2019). More and more the Generation Y and Z are delaying marriage in the U.S.
Figure 2. Men’s Percentage Marital Status Proportions 1950-2019
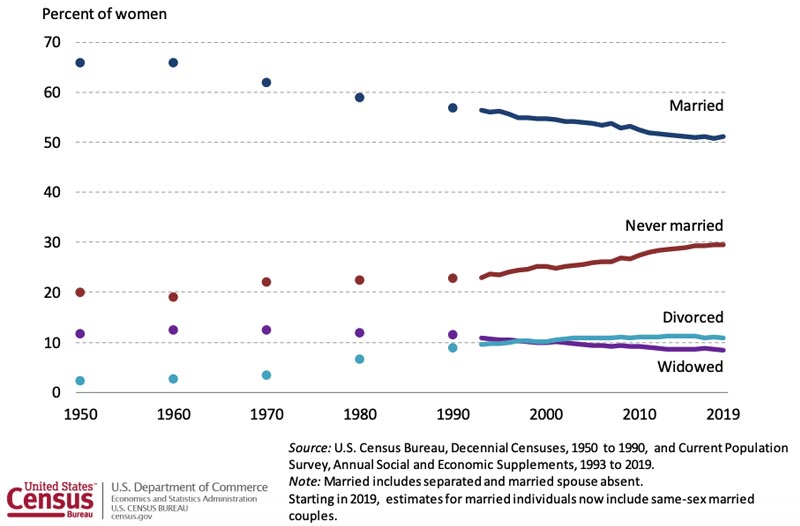
Look at Figure 3 below to see the U.S. trend of percentages of Women’s marital status types between the years 1950-2019. It shows that the most common marital status is still married (down from a high of about 68% in 1960 to about 51% in 2019). The rising trend is clearly among the never married singles which rose from about 20 percent in 1950 to about 30% in 2019). Again, more and more women among the Generation Y and Z are delaying marriage in the U.S.
Figure 3. Women’s Percentage Marital Status Proportions 1950-2019
Family Functions
What are the functions of families? In studying the family, Functional Theorists (see chapter 3) have identified some common and nearly universal family functions, meaning that almost all families in all countries around the world have at least some of these functions in common. Table 2 shows many of the global functions of the family.
Table 2. Global Functions of the Family
- Economic support—food, clothing, shelter, etc.
- Emotional support—intimacy, companionship, belonging, etc.
- Socialization of children—raising children, parenting
- Control of sexuality—defines and controls when and with whom (e.g., marriage)
- Control of reproduction—defines the types of relationships where children should/could be born
- Ascribed status—contexts of race, SES, religion, kinship, etc.
Economic Support

By far, economic support is the most common function of today's families. When your parents let you raid their pantry, wash your clothes for you, or replenish your checking account, that's economic support. For another young adult, say in New Guinea, if she captures a wild animal and cooks it on an open fire, that's also economic support in a different cultural context. I've always been amazed at how far family economic cooperation extends. Some families cooperate in businesslike relationships. In Montreal, Quebec, Canada, there is an established pattern of Italian immigrants helping family and friends emigrate from Italy to Canada. They subsidize each other's travel costs, help each other find employment once in Canada, and even privately fund some mortgages for one another. Each immigrant supported through this system is expected to later support others in the same manner. To partake in this form of economic cooperation is to assume a very businesslike relationship.
Emotional Support
Emotional relationships are also very common, but you must understand there is a tremendous amount of cultural diversity in how intimacy is experienced in various families around the world. Intimacy is the social, emotional, spiritual, intellectual, and physical trust that is mutually shared between family members. Family members share confidences, advice, trust, secrets, and ongoing mutual concern. Many family scientists believe that intimacy in family relationships functions as a strong buffer to the ongoing stresses family members experience outside of the home.
Socialization of Children
Socialization of children is covered in more detail in chapter 4. For now, keep in mind that children are born with the potential to be raised as humans. They will realize this potential if older family members or friends take the time to protect and nurture them into their cultural and societal roles. Today the family is the core of primary socialization. But many other societal institutions contribute to the process, including schools, religious establishments, workplaces, and media.
Control of Sexuality and Reproduction
The family has traditionally asserted control over sexuality and reproduction. A few centuries ago many fathers and mothers even selected the spouses for their children (they still do in many countries). Today, U.S. parents want their adult children to select their own spouses. Older family members tend to discourage unwed mothers and encourage pregnancy and childbirth only in marriage or a long-term relationship. Unwed Mothers are mothers who are not legally married at the time of the child's birth. Being unwed brings up concerns about economic, emotional, social, and other forms of support for the mother that may or may not be available from the father. Many unwed fathers reject their fatherly obligations while hundreds of thousands of others center their entire lives on their parenting responsibilities. Marriage no longer controls sexuality either at a cultural, criminal, or tax code level of sanctions being enforced (as it was in decades past).
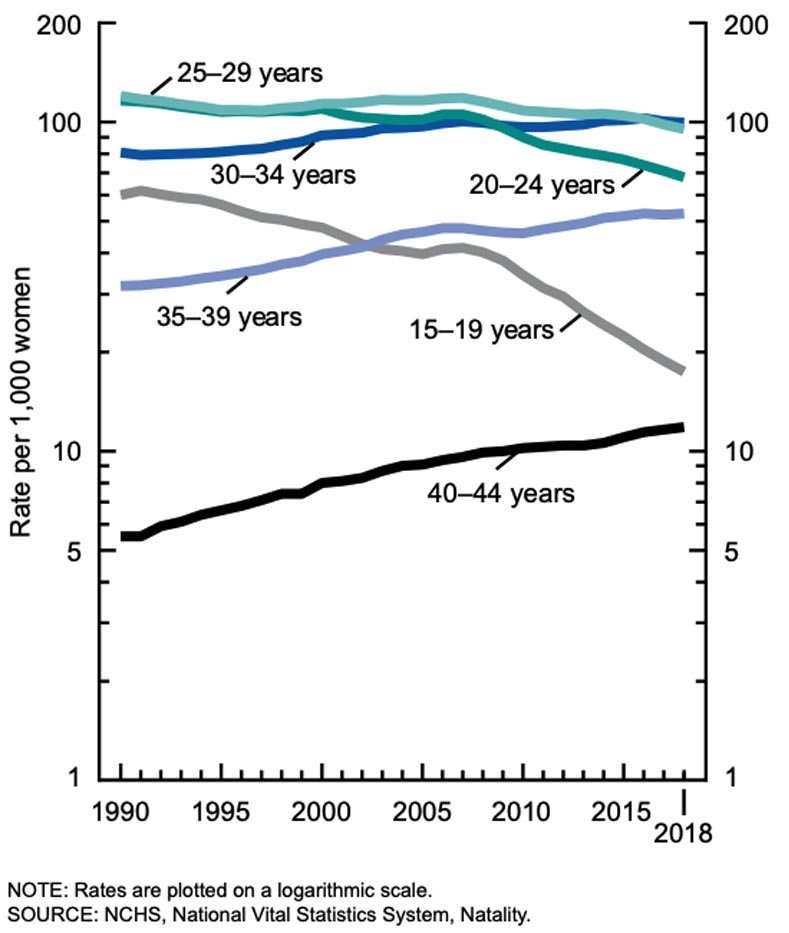
Figure 4 shows the birth rates in the U.S. for women, broken down by age categories. The 2 catgories which include 20-24 and 25-29 year old women have been declining steadily between 1990 and 2018. This is particularly impactful in the U.S. because historically about two-thirds of all U.S. births used to happen among the 20-29 year old women. The rates for 30-34, 35-39, and 40-44 year old women have slightly increased. The rates for the 15019 year olds have dramatically declined as have the rates of teen births in the same time period. Overall, the birth rate has dramatically declined since 2007. The births to unmarried women accounted for only 39.6 percent in 2018 but represents the lowest unmarried birth rate since 2009. This decline is present foir unmarried 15-19 year olds in the same years.
Figure 4 United States Birth Rates by Age Categories 1990-2018
In Chapter Twelve we discussed how grandparents are often raising their grandchildren during their later life years. Some times both parents are in the home, sometimes, only the mother and other times only the father. Sometimes neither parent is in the home. Sometimes the children have grandparents raising them for only a short period of time and many times they have grandparents as their “parents” for life. The latter is the case for Olympic Gold Medalist, Simone Biles (see Wikipedia page at https://en.wikipedia.org/wiki/Simone_Biles ). In many way Simone and her siblings who were all adopted out of the Ohio foster care system by relatives, had advantages in their childhood. The advantage her maternal grandparents gave her specifically included stability in residence, continuity of being raised by the same two people who served as her parents (Grandpa Ron and Grandma Nellie Biles), adequate food, a home schooling education and consistent opportunity to be trained and to develop her gymnastic abilities (just to name a few).
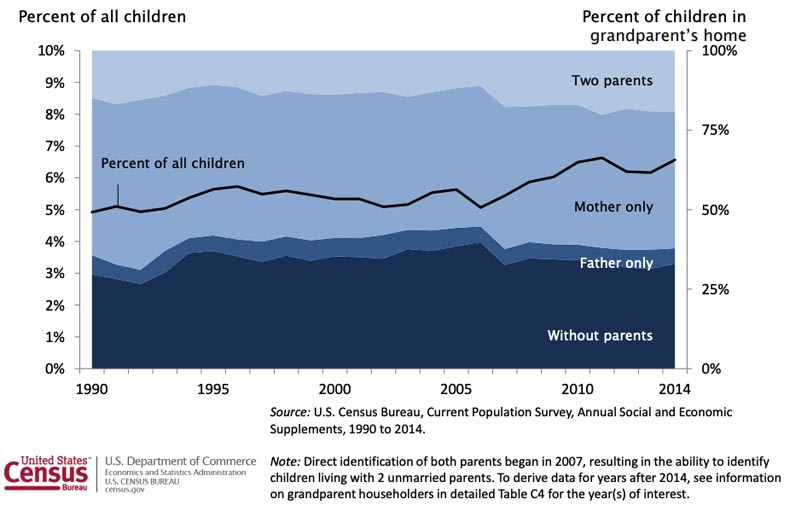
As previously mentioned, in the U.S. in 2014 there were approximately 73,692,000 children. Many were being raised in their grandparent’s home, some with a father, mother, both, or neither. Figure 5 shows the trend of which type of living arrangements U.S. children who live in the home of their grandparents experience between 1990 and 2014. This figure has percentage values on both sides of the vertical axis. On the left, you see the percentage of all children growing up in their grandparent’s home which is about 5 percent in 1990. Look at the rising and falling trend lines 1990 to 2014. That symbolically represents the consequences all these dramatic shifts in marital statuses and household compositions have; not on the adults involved but on the children involved. indicate steady larger social trends of grandparents providing kinship care.
Figure 5. Presence of parents for children living in the home of a grandparent*
Childhood instability=is the frequent change in household and marital/relationship status of parents over the course of the first 18 years of a child’s life. It can include any or all of the following: a child born to single, cohabiting, or married parent/s; a child who experiences parents’ divorce, separation, breakup of relationship, or remarriage or repairing of cohabiting parent/s; a child who loses parent/s to incarceration, drug addiction, or death; and a child who enters the state’s foster care system (just to name some of the more common scenarios). To help illustrate the nature of how all the larger social trends that have directly changed the U.S. family structures since 1960, I am using the 2010 book of one of my favorite contemporary Sociologists, Andrew J. Cherlin (see professional page at https://soc.jhu.edu/directory/andrew-j-cherlin/ ). Cherlin is a Sociological researcher that represents some of the best research Sociologists can conduct in modern societies. His 2010 book “The Marriage Go Round: The State of Marriage and the Family in America Today” (available in print or e-book form, Vintage Pub. 1st Ed ISBN 978-0307386380).
Cherlin’s book provides extensive insight and research to quantify the changes in the larger social and cultural levels of families in the United States over the last century leading up to the publishing of his 2010 book. One of the major claims he makes is that a shift in U.S. individualism has included only the individual now. Whereas in past decades “rugged individualism” with a heavy focus on collectivism (other focused) was courageous and allowed families to build in less inhabited parts of the country, but also focus specifically more on “individualism” as it included: me and my family.” A more detailed discussion of ‘individualism’ and “collectivism” in a variety of countries can be found at the Clearly Cultural Website (see Clearly Cultural Making Sense of Cross Cultural Communication retrieved 18 Jan 2019 http://clearlycultural.com/geert-hofstede-cultural-dimensions/individualism/ ). By 2010 a huge shift in individualism had gradually shifted away from “me and my family” toward simply “self-fulfillment of me” as each individual takes care of their own individual life goals and pursuits and adventures.
He shows (with exceptional research data to back up his assertions) how highly we in the U.S. truly value marriage, but also clearly shows how the individual “me-only” value that permeates Baby Boomer, Gens: X, Y, and now Z, collides with that high value of marriage in such a way that it leads to many of the trends we have already established in this textbook and that exists outside the scope of this textbook in international and historical data analysis. Table 3 shows a selection of some of the U.S. trends Cherlin articulates in comparison to similar European nations:
Table 3. Cherlin’s Reported Larger Social Trends Relating to Families in the United States
- In comparison to other nations, the U.S. has an exceptionally high positive regard for marriage.
- The U.S. is the only nation that experience a national legal battle of allowing same-sex couples to marry.
- In the U.S., we marry more, divorce more, and remarry more than takes place in other countries (Thus Cherlin’s “Marriage Go Round” book title)
- In the U.S. we have more children born to unmarried mothers
- As of 2010 the U.S. was the only nation spending federal money to promote marriage
- In the U.S. children experience shorter marriage duration periods (about twice as many U.S. children see their parents’ divorce in first 5 years (23%) compared to much lower percentages other countries; see page 206 tables).
- -In the U.S. children experience fewer long-term cohabiting duration periods (55% of U.S. parents break up within 5 years soon highest among other countries; see page 206 tables). -In the U.S. children born to single mothers have the highest average number of “father-like” adult men who move in and partner with their mother then leave soon (U.S. was an average of 3+ “father-like” partners of their mother compared to far fewer in other countries; see page 209).
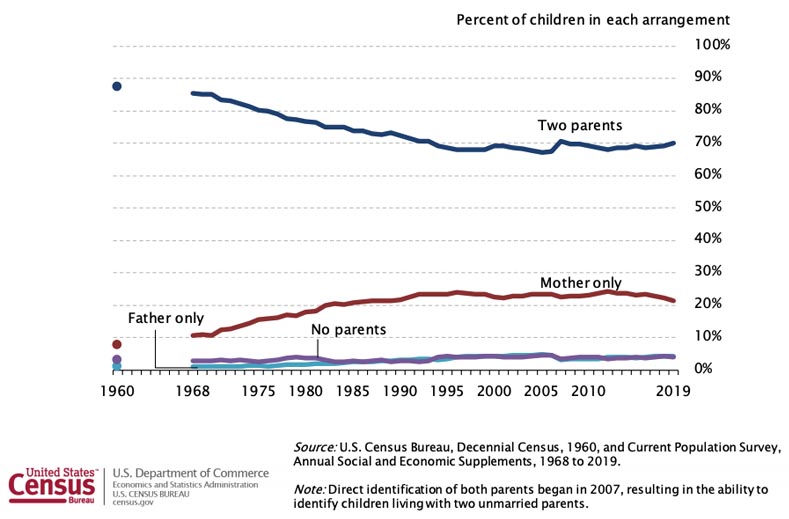
Cherlin also showed how U.S. remarriages end in divorce more often than first marriages do. The U.S. Census Bureau often publishes trends based on their many ongoing annual surveys and on decennial census data. Figure 6 shows the living arrangements of U.S. children between 1960 and 2019. The percentage of children living with two parents (Married and Cohabiting combined) declined from about 88 percent in 1960 down to around 70 percent in 2019. In 1960 most children who did live with married parents lived with their biological or adoptive parents with only a few who had been through their parents’ divorce, remarriage, and because of WWII remarriage after widowhood. In 2019, Many of the children in “two parent homes” have instable childhoods before the remarriage ever occurs (because of the larger social and personal trend of the “Marriage Go Round”).
Figure 6. Living Arrangements* of U.S. Children between 1960 and 2019.*
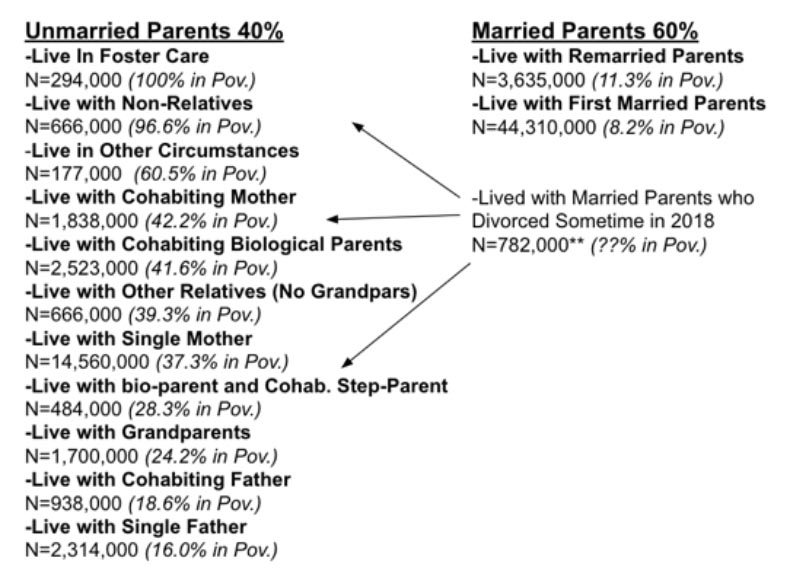
Finally, Figure 8 adds one more crucial dimension to the instability of U.S. children which is living in poverty which shows the 29.5 million living in unmarried homes (40%) and the 44.2 million who lived in married homes (60%) in 2018 and the percentage of each subcategories that lived in poverty. The subcategories are listed in descending order with the highest percent in poverty nearest the top of each list. In the right hand column of children living with married parents, we see the overall trend of children living in married homes with their original biological or adoptive parents (who were still in their first marriage) had the overall lowest percent living in poverty (8.2%) followed closely by children in homes with remarried parents (11.3%).
The subcategories in the left hand column were for children living in unmarried homes. A quick overview shows a clear gender trend with the lowest unmarried home-poverty rates to be found in homes with single fathers (16.0%) and cohabiting fathers (18.6%). The levels of poverty increase as you keep reading toward the top of the list with levels of poverty in the following types of homes being: Grandparent (24.2%); Bio-parent and Cohabitating step-parent (28.3%); single mother (37.3%); other than grandparent relatives (39.3%); cohabiting biological parents (41.6%); cohabiting mother (42.2%); “Other circumstances (60.5%); with non-relatives (96.6%); and with those children in formal foster care (100%). Foster Care Programs consider children to be “wards of state” and provide complete welfare support for the foster care givers, even if the caregivers are not themselves living in poverty. An entire book could be written on why these levels of poverty are so much higher for unmarried parent homes. But, for this online textbook we will point to the larger social trends of recording higher: cohabiting, divorce, single mothering, divorcing, drug and substance addiction, crime participation and incarceration levels among the less educated poor than among the more educated middle and upper class. Thus, the instability of children that continues as results of the unique “marriage Go Round” actions of parents in the U.S. is compounded by the experience of poverty.
Figure 7. U.S. Children (N=73,740,000): 2018* with Unmarried Homes (40%) & Married Homes (60%) with (% Living in poverty).*
Ascribed Status
Children are born into a family structure and at the time of their birth attain an Ascribed Status. As discussed in the Stratification Chapter (CH9) in the United States it is possible to change many of your birth-related ascribed statuses. But, what is a “Status?” Well with your friends, have you noticed that one or two tend to be informally in charge of the details? You might be the one who calls everyone and makes reservations or buys the tickets for the others. If so, you would have the informal role of "organizer." Status is a socially defined position, or what you do in a role. There are three types of status considerations: Ascribed Status is present at birth (race, sex, or class), Achieved Status is attained through one's choices and efforts (college student, movie star, teacher, or athlete), and Master Status stands out above our other statuses and distracts others from seeing who we really are
You were born into your racial, cultural-ethnic, religious and economic statuses. Those shaped to some degree the way you grew up and were socialized. By far in our modern societies, achieved status (which comes as a result of your own efforts) is more important than ascribed status (which you're born with) for most members of society. However, the degree of achievement you attain often depends heavily on the level of support your family gives to you and the stability or instability in the home you grow up in that allows you to develop and mature at multiple levels or to not develop.
Another consideration about roles is the fact that one single role can place a rather heavy burden on you (e.g., student). Role Strain is the burden one feels within any given role. And when one role comes into direct conflict with another or other roles, you might experience role conflict. Role Conflict is the conflict and burdens one feels when the expectations of one role compete with the expectations of another role.
Groups
The first and most important unit of measure in sociology is the Group, which is a set of two or more people who share common identity, interact regularly, have shared expectations (roles), and function in their mutually agreed upon roles. Most people use the word "group" differently from the sociological use. They say "group" even if the cluster of people they are referring to don't even know each other (like six people standing at the same bus stop). Sociologists call such a cluster an "Aggregate," which is a number of people in the same place at the same time. So, clusters of people in the same movie theater, people at the same bus stop, and even people at a university football game are considered aggregates rather than groups. Sociologists also discuss categories. A Category is a number of people who share common characteristics. Brown-eyed people, people who wear hats, and people who vote independent are categories—they don't necessarily share the same space, nor do they have shared expectations. In this text we mostly discuss trends and patterns in family groups and in large categories of family types.

Family groups are crucial to society and are what most of you will form in your own adult lives. Groups come in varying sizes. For example, Dyads, which are groups of two people, and Triads, which are groups of three people. The number of people in a group plays an important structural role in the nature of the group's functioning. Dyads are the simplest groups because two people have only one relationship between them. Triads have three relationships. A group of four has six relationships, five has 10, six has 15, seven has 21, and one of my students from Brazil has 10 brothers and sisters and she counts 91 relationships just in her immediate family (not counting the brothers- and sisters-in-law). When triads form it looks much like a triangle, and these typically take much more energy than dyads. A newly married couple experiences great freedoms and opportunities to nurture their marital relationship. A triad forms when their first child is born. Then they experience a tremendous incursion upon their marital relationship from the child and the care demanded by the child.
As sociologists have further studied the nature of the group's relationships, they have realized that there are two broad types of groups: Primary Groups, which tend to be smaller, less formal, and more intimate (you and your family members and friends), and Secondary Groups, which tend to be larger, more formal, and much less personal (you and your doctor, mechanic, or accountant). Typically, with your primary groups, say with your family, you can be much more spontaneous and informal. On Friday night you can hang out wherever you want, change your plans as you want, and experience fun as much as you want. Contrast that to the relationship with your doctor: You have to call to get an appointment, wait if the doctor is running behind, and address him or her as "Doctor." Then, once the diagnoses and co-pay are made, you have to make another formal appointment if you need another visit. Your family and friends tend to be few in numbers and primary in nature. Your Introduction to Sociology class is most likely large and secondary.
Family Systems Theory
One core definition that will help you in studying the family is that of Family Systems. Family Systems Theory claims that the family is understood best by conceptualizing it as a complex, dynamic, and changing collection of parts, subsystems and family members. Much like a mechanic would interface with the computer system of a broken-down car to diagnose which systems are broken (transmission, electric, fuel, etc.) and repair them, a therapist or researcher would interact with family members to diagnose how and where the systems of the family are in need of repair or intervention. Family Systems Theory comes under the Functional Theory umbrella and shares the functional approach of considering the dysfunctions and functions of complex groups and organizations.
Sociological Imagination
The average person lives too narrow a life to get a clear and concise understanding of today's complex social world. Our daily lives are spent among friends and family, at work and at play, and watching TV and surfing the internet. There is no way one person can grasp the big picture from his or her relatively isolated life. There's just not enough time or capacity to be exposed to the complexities of a society of 310 million people. There are thousands of communities, millions of interpersonal interactions, billions of internet information sources, and countless trends that transpire without many of us even knowing they exist. What can we do to make sense of it all?
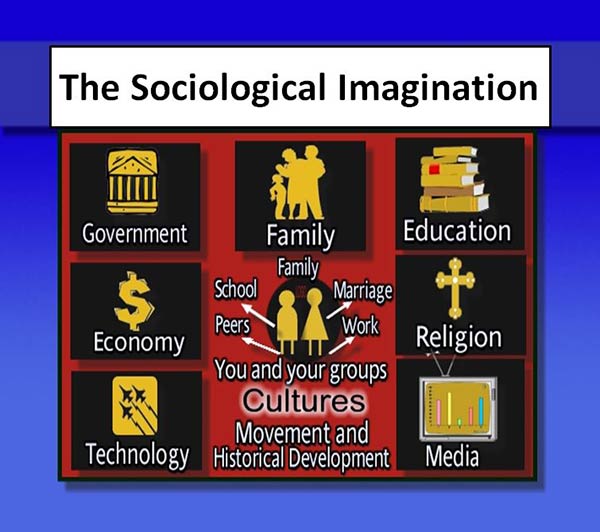
Psychology gave us the understanding of self-esteem, economics gave us the understanding of supply and demand, and physics gave us the Einstein theory of E=MC2. When I learned of the Sociological Imagination by Mills, I realized that it gives us a framework for understanding our social world that far surpasses any common-sense notion we might derive from our limited social experiences. C. Wright Mills (1916-1962), a contemporary sociologist, suggested that when we study the family we can gain valuable insight by approaching it at two core societal levels. He stated, "neither the life of an individual nor the history of a society can be understood without understanding both" (Mills, C. W. 1959. The Sociological Imagination. Oxford Univ. Press, p. ii). Mills identified "Troubles" (challenges on the personal level) and "Issues" (challenges on the larger social level) as key principles for wrapping our minds around many of the hidden social processes that transpire in an almost invisible manner in today's societies. Look at Figure 8 below to see a diagram of the Sociological Imagination and its two levels (personal and larger social).
Personal Troubles are private problems experienced within the character of the individual and the range of their immediate relation to others. Mills identified the fact that we function in our personal lives as actors and actresses who make choices about our friends, family, groups, work, school, and other issues within our control. We have a degree of influence in the outcome of matters within the personal level. A college student who parties 4 nights out of 7, who rarely attends class, and who never does his homework has a personal trouble that interferes with his odds of success in college. But when 50 percent of all college students in the country never graduate, we call it a larger social issue.
Larger Social Issues lie beyond one's personal control and the range of one's inner life. These pertain to society's organization and processes. To better understand larger social issues, we need to define social facts. Social Facts are social processes rooted in society rather than in the individual. Émile Durkheim (1858-1917, France) studied the "science of social facts" in an effort to identify social correlations and ultimately social laws designed to make sense of how modern societies worked given that they became increasingly diverse and complex (Durkheim, Émile. 1982. The Rules of the Sociological Method. Ed. Steven Lukes; trans. W.D. Halls. New York: Free Press, p. 50-59).

The war in the Middle East, the repressed economy, the national cost of a gallon of gas, the trend of having too few females in the 18- to 24-year-old singles market, and the ever-increasing demand for plastic surgery are just a few of the social facts at play today. Social facts are typically outside of the control of average people. They occur in the complexities of modern society and impact us, but we rarely find a way to significantly impact them back. This is because, as Mills taught, we live much of our lives on the personal level and much of society happens at the larger social level. Without a knowledge of the larger social and personal levels of social experience, we live in what Mills called a False Social Conscious, which is an ignorance of social facts and the larger social picture.
A larger social issue is illustrated in the fact that nationwide; students come to college as freshmen ill-prepared to understand the rigors of college life. They often haven't been challenged enough in high school to make the necessary adjustments required to succeed as college students. Nationwide, the average teenager text messages, surfs the internet, plays video or online games, hangs out at the mall, watches TV and movies, spends hours each day with friends, and works at least part-time. Where and when would he or she get experience focusing attention on college studies and the rigors of self-discipline required to transition into completing college credits, studying, writing papers, completing projects, working on field study trips, participating in group work, or taking tests?
Figure 8. Diagram of the Seven Social Institutions and the Sociological Imagination
The real power of the Sociological Imagination is found in learning to distinguish between the personal and social levels in our own lives. Once we do that, we can make personal choices that serve us the best, given the larger social forces that we face. In 1991, I graduated with my Ph.D. and found myself in a very competitive job market for university professor/researcher positions. With hundreds of my own job applications out there, I kept finishing second or third and was losing out to 10-year-veteran professors who applied for entry-level jobs. I looked carefully at the job market, my deep interest in teaching, the struggling economy, and my sense of urgency in obtaining a salary and benefits. I came to the decision to switch my job search focus from university research to college teaching positions. Again, the competition was intense. On my 301st job application (that's not an exaggeration); I obtained an interview and beat out 47 other candidates for my current position. In this case, it was helpful to know and see the larger social issues that impacted my success or failure in finding a position. Because of the Sociological Imagination, I understood the larger social job market and was able to best situate myself within it to solve my personal trouble.
Simply studying something does not imply that you agree with it or support it for yourself or others any more than studying diseases in your basic health class means you have to go out and get one or support others in getting one. One of the many benefits of being a college student is that it expands and broadens your opinions. I found in my eight years of college and university studies that my opinions became more entrenched and I was able to better understand my values and defend my own views. By keeping my mind open and being willing to learn new things, I graduated a better person than I started. I challenge you to keep your mind open. Trust that learning doesn't mean changing for the worse.
As mentioned above, the Industrial Revolution changed societies and their families in an unprecedented way, such that sociology as a discipline emerged as an answer to many of the newfound societal challenges. Societies had changed and formed a new collective of social complexities that the world had never witnessed before. The Industrial Revolution transformed society at every level. Look at Table 4 below to see pre- and post-Industrial Revolution social patterns and how different they were.
Table 4. Pre-Industrial and Post-Industrial Revolution Social Patterns
| Pre-Industrial Revolution | Post-Industrial Revolution |
|---|---|
| Farms/Cottages | Factories |
| Family Work | Breadwinners/Homemakers |
| Small Towns | Large Cities |
| Large Families | Small Families |
| Homogeneous Towns | Heterogeneous Cities |
| Lower Standards of Living | Higher Standards of Living |
| People Died Younger | People Die Older |
Prior to the Industrial Revolution, families lived on small farms and every able member of the family did work to support and sustain the family economy. Towns were small and very similar (homogeneity), and families were large (more children = more workers). There was a lower standard of living, and because of poor sanitation people died earlier. After the Industrial Revolution, farm work was replaced by factory work. Men left their homes and became breadwinners, earning money to buy many of the goods that used to be made by hand at home (or bartered for by trading one's own homemade goods with another's). Women became the supervisors of homework. Many families still worked to develop their own home goods, and many women and children also went to the factories to work. Cities became larger and more diverse (heterogeneity). Families became smaller (less farm work required fewer children). Eventually, standards of living increased and death rates declined.
It is important to note the value of women's work before and after the Industrial Revolution. Hard work was the norm and still is today for most women. Homemaking included much unpaid work. Take my own granny "grandmother" as an example. She passed away recently at age 101! She worked hard her entire life, both in a cotton factory and at home raising her children, grandchildren, and at times great-grandchildren. When I was a boy, she taught me how to make lye soap by saving the fat from animals the family ate. She took a metal bucket and poked holes in the bottom of it. Then she burned twigs and small branches until a pile of ashes built up in the bottom of the bucket. After that she filtered water from the well through the ashes and collected the lye water runoff in a can. She heated the animal fat and mixed it in the lye water from the can. When it cooled, she cut it up and used it as lye soap. She would also take that lye water runoff and soak dried white corn in it. The corn kernel shells would become loose and slip off after being soaked. Granny would rinse this shelled corn and use it for hominy or grind it up and make grits from it.
These pre- and post-Industrial Revolution changes impacted all of Western civilization, because the Industrial Revolution hit all of these countries about the same way: Western Europe, the United States, Canada, and later Japan and Australia. The Industrial Revolution brought with it some rather severe social conditions, which included deplorable city living conditions, crowding, crime, extensive poverty, inadequate water and sewage facilities, early death, frequent accidents, extreme pressures on families, and high illness rates. Today, sociology continues to rise to the call of finding solutions and answers to complex social problems, especially in the family.
Family Research
The American Sociological Association is the largest professional sociology organization in the world. One section of ASA members focuses its studies specifically on the family. Here is an excerpt of that section's mission statement:
"Many of society's most pressing problems -- teenage childbearing, juvenile delinquency, substance abuse, domestic violence, child and elder abuse, divorce -- are related to or rooted in the family. The Section on Family was founded to provide a home for sociologists who are interested in exploring these issues in greater depth." (Retrieved 16 July 2020 from SOURCE)
Many family sociologists also belong to the National Council on Family Relations. This council's mission statement reads as follows:
"The National Council on Family Relations (NCFR) provides an educational forum for family researchers, educators, and practitioners to share in the development and dissemination of knowledge about families and family relationships, establishes professional standards, and works to promote family well-being." (Retrieved July 2020 from SOURCE)
There are other family-related research organizations in the world, but these two rank among the largest and most prestigious organizations in the field of family studies. As with all of sociology and other social sciences, science and scientific rigor are paramount. It is not enough to simply study the family from our narrow personal points of view. We have to reach into the larger social picture and see the hidden social processes that teach us how to inform marriage and family therapy, provide useful and accurate data to governmental and policy-making figures, and provides reliable advice that will help the most people in the most efficient way.
This becomes a scientific endeavor then to study and examine the family with rules of scientific engagement and analysis. Those earning a Ph.D. in a family-related field learn and execute this science with rigor. If researchers make the results of their study public and present them for critical review by other family scientists, then scientific rigor is even stronger and the findings can be afforded more credibility. For example, studies have shown that the leading factor of divorce is not any of the following: sex problems, failures to communicate, money mismanagement, nor even in-law troubles. What is the leading cause of divorce?
Additional Reading
Search the keywords and names in your Internet browser
- Army Strong Bonds program LINK
- MARRI Marriage and religion research institute LINK
- Building Strong Marriages LINK
- Help for Grandparents and other Relatives Raising their relative’s children http://grandfamiliesutah.org/
- What Divorce Cost us in the US LINK
National Stepfamily Resource Center (NSRC) is a national, nonprofit membership organization dedicated to successful stepfamily living. This site provides educational information and resources for anyone interested in stepfamilies and their issues.
(Formerly the Stepfamily Association of America (SAA)) LINK
Key Sociological Concepts:
- Sociology of the Family
- Families in society
- Sociological Imagination and families
- Family demography
- Social class and family issues
- Families in social change
- Family diversity
- Urban families
- Rural families
- Same-sex families
- Heterosexual families
- Nuclear families
- Extended families
- Kinship families
- Fictive kinship families
- Gender roles
- Cross-cultural families
- Middle income countries
- Low income countries
- High income countries
- Feminist family sociology
- Social construction of family and roles
- Division of family labor
- Consumerism and the family
- Anomie and the family
- Religion and the family
- Sociology of marriage
- Sociology of mothers, fathers, and parents
- Family structural changes
- Widowhood
- Never-married singles
- Married
- Cohabitation
- Single parenting
- Divorced
- Remarried
- Family instability
- Fragile families
- Sociology of childhood
- Emerging adulthood
- Technology and the family
- Media/cultural roles and families
- Family boundaries
- Polygamy
- Queer theory of families
- Same-sex marriage
- Men’s movement and families
- Unwed motherhood
- Work-family and dual-earner families in balance
- Families and the law
Key Family Sociologists:
- Emile Durkheim (1958-1917)
- Albion Small (1854-1926)
- Lester Ward (1841-1913)
- Charles Horton Cooley (1864-1929)
- Jane Addams (1860-1935) LINK
- George Herbert Mead (1863-1931) LINK
- Talcott Parsons (1902-1979)
- C. Wright Mills (1916-1962)
- Erving Goffman (1922-1982)
- Contemporary Family Sociologists:
- Paul R. Amato
- Larry Bumpass
- James A. Sweet
- Paul C. Glick
- David Popenoe
- Linda J. Waite
- Richard J. Gelles
- William J. Goode
- Murray A. Straus
- Lawrence H. Ganong
- Deborah Tannen
- Andrew J. Cherlin
- Norvall Glen
- Arlie Russell Hochschild
- Alice S. Rossi